
Typically I used Python, matplotlib, etc. to plot the actions of the data to verify it and to determine the solution. This is actually one of the better solutions from a data science perspective these days. But I’ve been using Go for almost a year now, and as a data scientist, I feel compelled to know how to plot data as a starting point.
This is a simple Golang Plotting tutorial that will introduce you to a few of the libraries I use, along with a few examples.
Plotinum and gonum-plot
Plotinum was the original plotting library that was developed by Google for Go, and it supported quite a few of the basic plots and shapes – you could create lines, point plots, custom ticks, error bars, etc.
gonum/plot is the official fork of plotinum and has since had 693 commits till date. It provides an API for building and drawing plots in Go.
gonum/plot examples
1. Histogram
So, now let’s start plotting some basic histograms and stuff. Let’s start by getting the gonum package in the terminal using:
sudo snap install go --classic
go get gonum.org/v1/plot/...
Create a new directory plotting data and the file plotter.go:
package main

import (
	"math/rand"

	"gonum.org/v1/plot"
	"gonum.org/v1/plot/plotter"
	"gonum.org/v1/plot/vg"
)
Now, in the main function we create an array of 1000 values and then using the rand package, we input random values from a normal distribution into it:
func main() {
	//make data
	var values plotter.Values
	for i := 0; i < 1000; i++ {
		values = append(values, rand.NormFloat64())
	}
	//boxPlot(values)
	//barPlot(values[:4])
	histPlot(values)

}
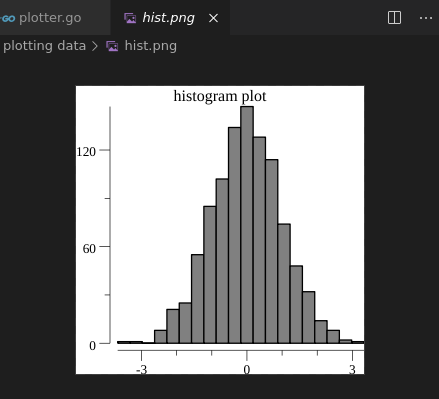
For the histogram plot, we make a function histPlot which used gonum’s NewHist function:
func histPlot(values plotter.Values) {
	p, err := plot.New()
	if err != nil {
		panic(err)
	}
	p.Title.Text = "histogram plot"

	hist, err := plotter.NewHist(values, 20)
	if err != nil {
		panic(err)
	}
	p.Add(hist)

	if err := p.Save(3*vg.Inch, 3*vg.Inch, "hist.png"); err != nil {
		panic(err)
	}
}
If you run this file, you’ll get a new file in the same directory called hist.png :
2. Barplots
Another popular plot is a barplot, so we can look at that also. It is quite similar to the above…we’ll just modify here and there. We can reuse the random number generator:
func main() {
	//make data
	var values plotter.Values
	for i := 0; i < 1000; i++ {
		values = append(values, rand.NormFloat64())
	}
	//boxPlot(values)
	barPlot(values[:4])

}
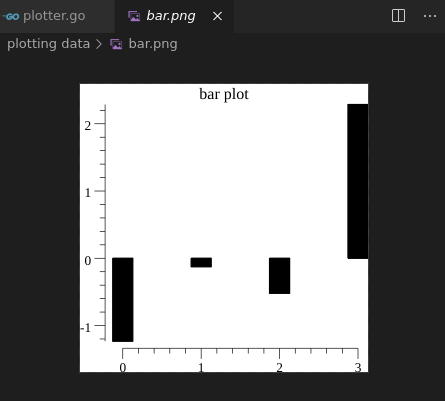
The barplot function will also be similar:
func barPlot(values plotter.Values) {
	p, err := plot.New()
	if err != nil {
		panic(err)
	}
	p.Title.Text = "bar plot"

	bar, err := plotter.NewBarChart(values, 15)
	if err != nil {
		panic(err)
	}
	p.Add(bar)

	if err := p.Save(3*vg.Inch, 3*vg.Inch, "bar.png"); err != nil {
		panic(err)
	}
}
If we go run plotter.go, we get another file this time:
3. Boxplots
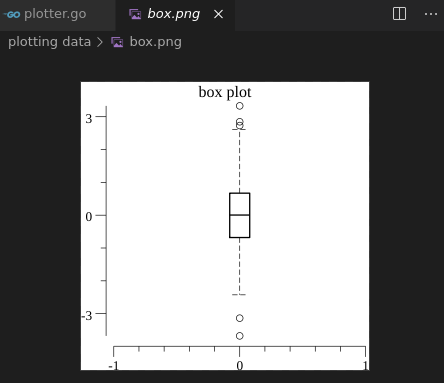
Okay, so we’ll do one last. This time a box plot. We’ll reuse the same code again with minor changes:
func boxPlot(values plotter.Values) {
	p, err := plot.New()
	if err != nil {
		panic(err)
	}
	p.Title.Text = "box plot"

	box, err := plotter.NewBoxPlot(vg.Length(15), 0.0, values)
	if err != nil {
		panic(err)
	}
	p.Add(box)

	if err := p.Save(3*vg.Inch, 3*vg.Inch, "box.png"); err != nil {
		panic(err)
	}
}
And then go run plotter.go, we get:
Go Chart libraries
I call these the “chart” libraries, because both of their individual developers decided to name their package chart.
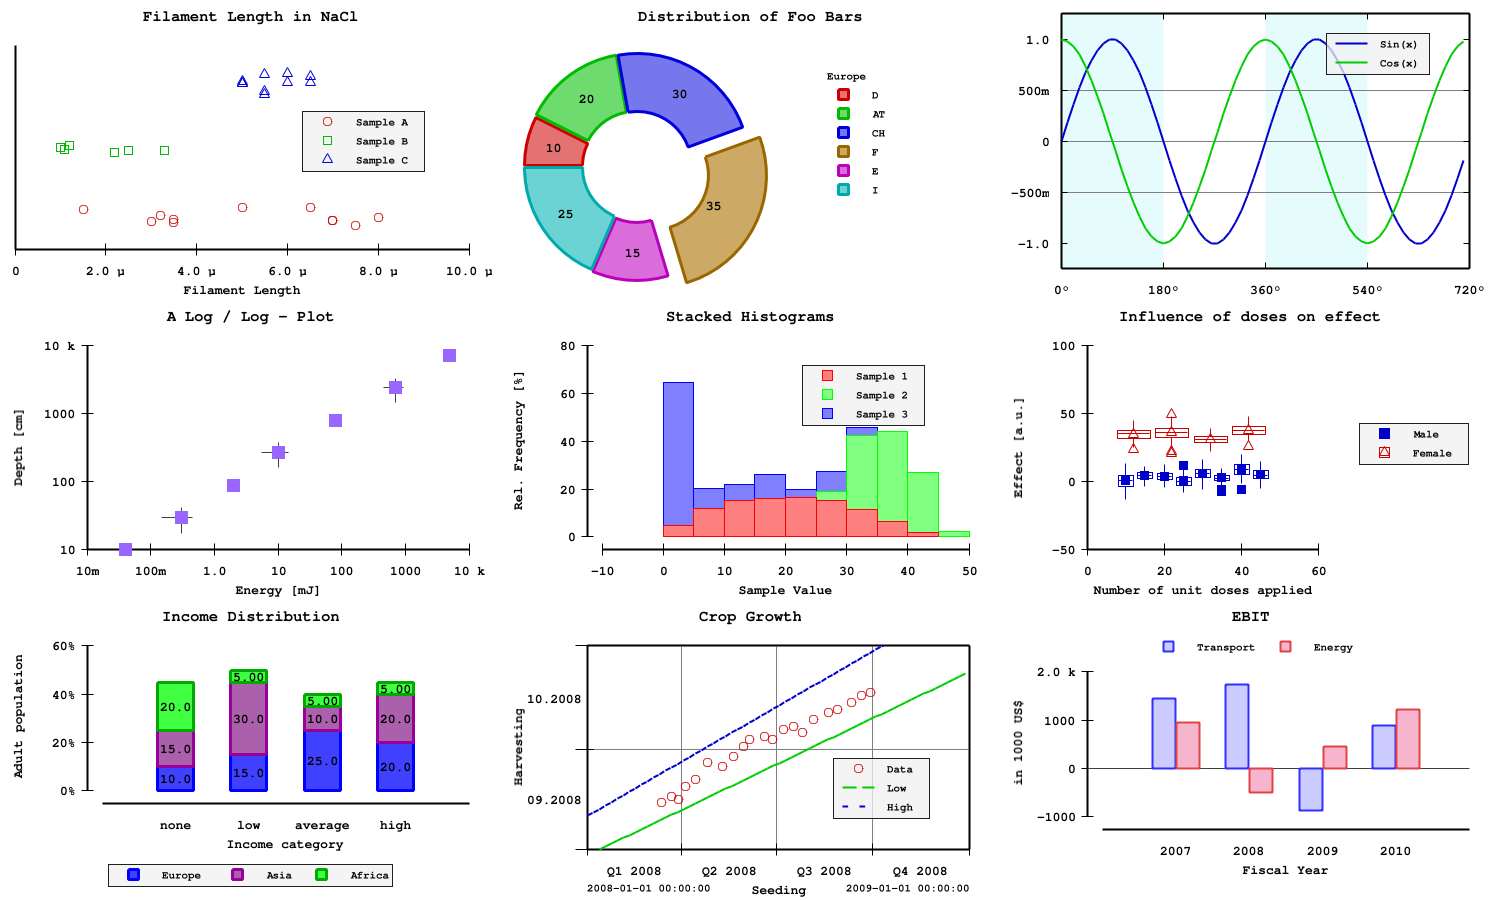
As you can see, there are various styles and output formats to suit every need.
glot
A similar plotting library to “chart”, but that has a very easy and intuitive approach is glot.
glot is a plotting library for Golang built on top of gnuplot. glot currently supports styles like lines, points, bars, steps, histogram, circle, and many others. You can go through the documentation here.
As you can see from the code snippet below, it is easy to use:
package main

import "github.com/Arafatk/glot"

func main() {
	dimensions := 2
	persist := false
	debug := false
	plot, _ := glot.NewPlot(dimensions, persist, debug)
	pointGroupName := "Simple Circles"
	style := "circle"
	points := [][]float64{{7, 3, 13, 5.6, 11.1}, {12, 13, 11, 1,  7}}
        plot.AddPointGroup(pointGroupName, style, points)
	plot.SetTitle("Example Plot")
	plot.SetXLabel("X-Axis")
	plot.SetYLabel("Y-Axis")
	plot.SetXrange(-2, 18)
	plot.SetYrange(-2, 18)
	plot.SavePlot("2.png")
}
Community Plotters
The gonum/plot/plotter package comes with only a small set of Plotters. But anyone can write a Plotter, and there are many “Community plotters”, i.e, made by the community.
For example, these are better for a bitcoin time series analysis:
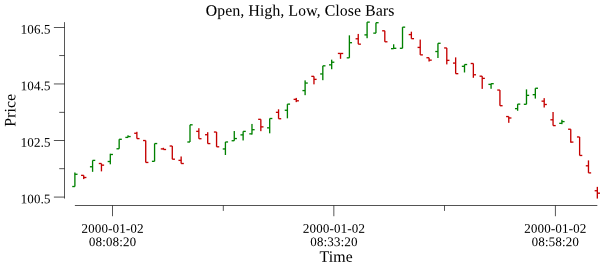
or this one:
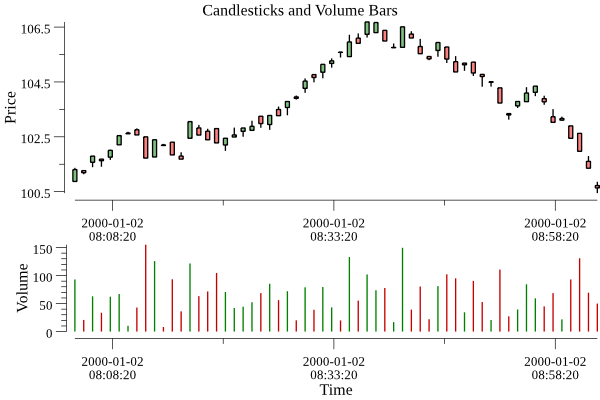
If you write a cool plotter that you think others may be interested in using, then even you can talk to them about it and perhaps get it integrated into the official gonum/plot repository !
Interactive Plots – quick note
There’s a developer known as sindbach who has implemented his own interactive scatter plots, i.e, a mouse click is received on the widget and correlates it back to an item on the texture/bitmap to find out which entry point was clicked.
You can find the full code here, and it’s a little advanced. It uses a library called Nuklear which is a ANSI GUI library implementation on Go.
References
- https://github.com/wcharczuk/go-chart
- https://github.com/vdobler/chart
- https://pkg.go.dev/gonum.org/v1/plot/plotter