
Profiling is an important task that cannot be avoided for larger applications. Profiling helps us understand CPU and memory intensive code and helps us write better code for optimization. In this post, we are going to take a look at the pprof package which helps us do the profiling in Go.
What is profiling?
Profiling is a form of analyzing the program for optimizable code or functions. In software engineering, it is an essential task since optimization is a key factor when developing an application. Avoiding memory leaks and optimizing for better performance is almost always a target for enterprise-level software.
Creating CPU profiles in Golang
Now, we will create CPU profiles for a function.
To create any profile first we need to have a test file. Here we are going to use the Fibonacci function to see profiles of it. We first will use the recursive general program and see if it is inefficient or not.
// main.go
package main

func Fib2(n int) uint64 {
	if n == 0 {
		return 0
	} else if n == 1 {
		return 1
	} else {
		return Fib2(n-1) + Fib2(n-2)
	}
}

func main() {
	// fmt.Println(Fib2(30)) // 832040
}
Now, the test file is:
// main_test.go
package main

import "testing"

func TestGetVal(t *testing.T) {
	for i := 0; i < 1000; i++ {             // running it a 1000 times
		if Fib2(30) != 832040 {
			t.Error("Incorrect!")
		}
	}
}
Now when we run go test we see:
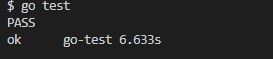
It took almost 7s to complete. Now let’s create a CPU profile. We will use this command shown below to generate a profile file.
go test -cpuprofile cpu.prof -bench .
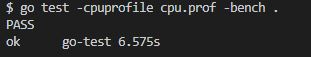
Now, we will view it using the pprof tool. The command will be:
go tool pprof cpu.prof
Now, it will open a CLI.
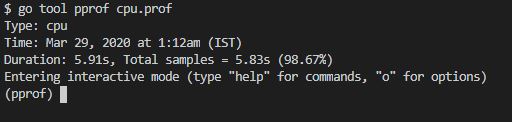
In the CLI we can write commands. Typing help will show all commands available. We will run the following command.
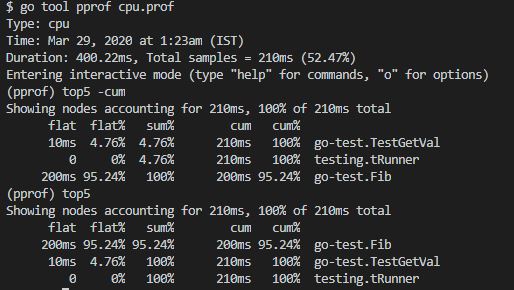
top5 -cum
The topN function shown top N entries and the -cum flag shows the cumulative time taken.
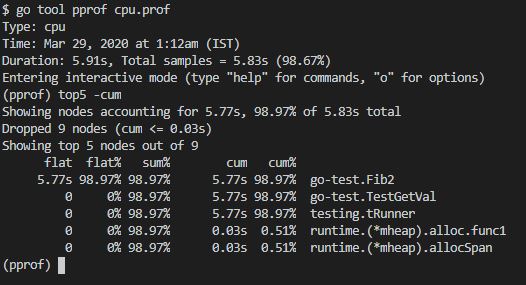
As clearly seen, the Fib2 function takes a huge time compared to others as the flat column shows the time taken by it alone.
Now, we will write an efficient version of it that avoids recursive calls by caching the result.
var f [100010]uint64

func Fib(n int) uint64 {
	f[0] = 0
	f[1] = 1

	for i := 2; i <= n; i++ {
		f[i] = f[i-1] + f[i-2]
	}

	return f[n]
}
Now, let’s do the same task for the other.
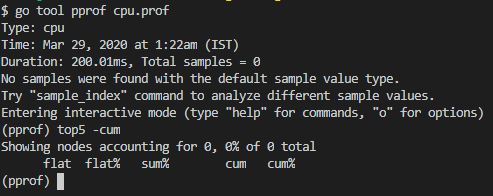
This function took 200ms and no results are shown since it is really fast. So, let’s do it for 5 million times.
Even with 5 million it still is very fast. The previous implementation took 7s for 1000 iterations and this implementation took 200ms for 5000000 iterations.
Creating memory profiles in Golang
To create a memory profile we simply use this command:
go test -memprofile mem.prof -bench .
Now, the function is slightly changed:
func Fib(n int) uint64 {

	f := make([]uint64, 10000)       // make huge allocation

	f[0] = 0
	f[1] = 1

	for i := 2; i <= n; i++ {
		f[i] = f[i-1] + f[i-2]
	}

	return f[n]
}
Now, we are making huge array allocation so that it will be shown by the profiler.
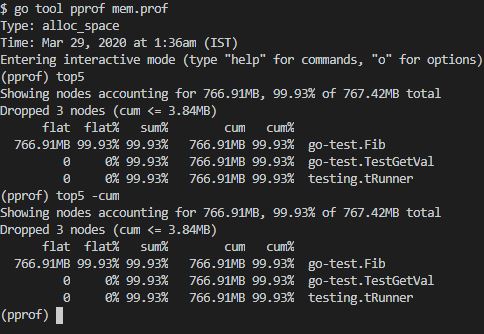
A whopping 766mb is created after running it 10000 times. This shows the power of the profiler.
Generating both profiles in Go
We can generate both profiles using the following command:
go test -cpuprofile cpu.prof -memprofile mem.prof -bench .