
Since its creation, Golang has been gaining popularity amongst programmers. Many developers and teams are moving to Golang from other languages like Python, Ruby, and Node.
There are numerous reasons for moving to https://go.dev/:
- Resource optimization
- Concurrency
- Efficiency
- High Speed
- Scalability
The most common reasons developers love the language are the high speed it provides and the ease of scalability.
As an application’s code increases in length and complexity, the application’s performance takes a hit. It happens all the time, and it is inevitable. Then, of course, developers start questioning the language or the framework they have chosen, but it’s always the way the code is written that causes the pain.
Tips for Performance Improvement
Here are a few points that will help you improve the efficiency and performance of your Golang application:
- Use multiple cores of the CPU: Goroutines is the feature that makes concurrency easy to implement in Golang. Though programmers choose to run the routines on a single core in most cases, there is a way to utilize more than one core to run the Goroutines. You can use “`GOMAXPROCS“` environment variable to set the number of cores that Goroutines uses. You need to choose this number wisely. If your Goroutines communicate a lot, it is better to be on one core. Else, using multiple cores can be advantageous.
- Avoid the overuse of Goroutines: I have witnessed the scenario of too many Goroutines getting fired; sometimes, it’s nested in many levels. This can cause severe performance degradation. It is advisable to limit the use of Goroutines to the optimal level.
- Optimize the map: It is advisable to use integers in the key to the maps you create in the application. It is always faster to fetch values if your key contains integers.
- Re-use variables in the hot-code—give the garbage collector a breather: In the part of the code that is called several times, if you allocate new objects/variables, it takes time to create them. This makes the garbage collector do more work when you come out of the block of code. If you use already initialized objects, the garbage collector’s work is reduced, and this improves the speed of the application.
- Check StringBuffer and StringBuilder: In the code, we often use operators like ‘+’ and ‘+=’ to concatenate strings. These operators are convenient for the developer but, at the same time, every time you use these, a new string object is created in the memory.
- Appropriate sizes for the Arrays: When the number of entries in an array reaches the max size, the array size is doubled, and the array is copied to a new location in the memory that engages the garbage collector. If the array size is allocated appropriately, the application performance does not take a hit.
If you are interested in knowing more best practices for writing great and performance-driven code, you should definitely check some online repositories.
Finding the Pain Points in Your Application
It’s always good to know ways of improving the speed or performance of your application. However, it’s never easy to find the parts of the code that are causing the degradation, especially when the codebase is large. In these cases, profilers come in handy.
Profilers do dynamic analysis of the program to measure the performance in many aspects, like CPU utilization and memory allocation. Profilers also point out the piece of code that is misbehaving: consuming a lot of the CPU’s capacity or making too many calls to a method.
Profilers are great for finding performance issues in your application. They relieve you of the task of worrying about performance so you can focus on creating code. If you want to take it a step further, you can find a profiler that performs continuous profiling in the production environment itself.
In the following section, we discuss two tools—a traditional profiler and a continuous profiler—so you can understand how each adds value to your development process.
Profiling Tools
gProfiler
gProfiler is a continuous profiling tool that is easy to integrate and has a beautiful dashboard that helps you dig into your code and find bottlenecks. It enables you to get visibility into your production environment.

gProfiler helps you identify most performance-impacting lines of code and provides you smoother running code.
I particularly like the tool for these reasons:
- Optimizes code’s CPU usage and running cost
- Runs in the background, so it doesn’t consume too many resources
- Finds performance bottlenecks in the production environment itself
- Provides seamless integration: just plug and play
Pprof
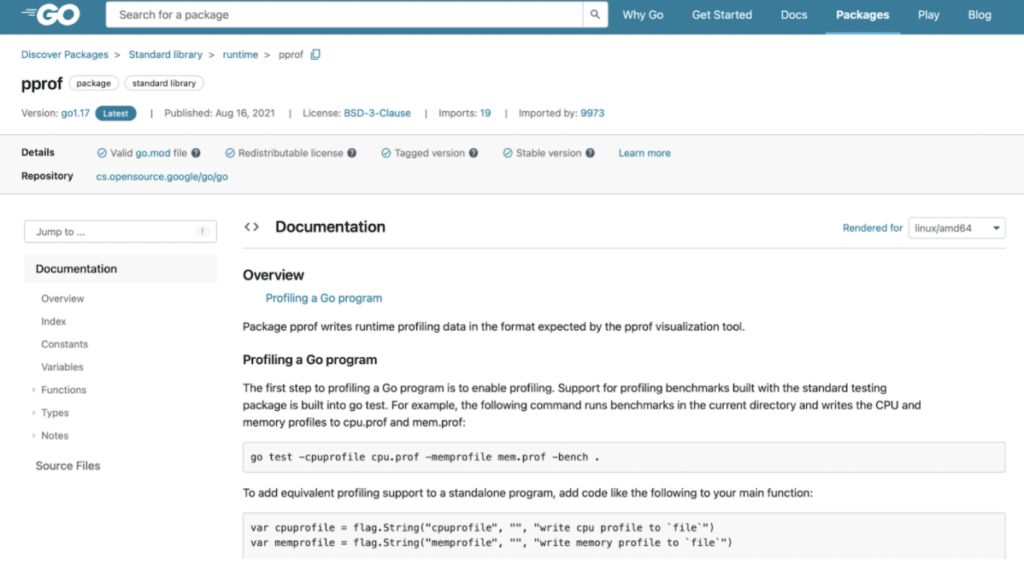
One of the most popular profiling tools amongst developers is ‘pprof’. pprof monitors the following details at runtime based on the profile you select:
- CPU usage
- Memory usage
- Thread and Goroutines
- Block
- Mutex
Pprof is easy to use and provides you a clear view of your application code. Though pprof is a great tool for finding performance hindering code in your application, you need to manually add the code to monitor the profiles mentioned above. This is the key point of difference between pprof and gProfiler, the continuous profiler discussed earlier.
Wrapping It Up
In my experience, when you start a new project, you don’t face performance issues. As the project codebase grows, however, a point comes when you start seeing degradation in the performance.
It is never a good idea to ignore the degradation till it becomes difficult to ignore. If you do, the problem then becomes too big and complex and takes much longer to resolve. You need to solve bottlenecks as they emerge.
Integrating continuous profiling in your CI/CD pipeline giving you regular feedback about the changes in the performance of your application. This brings in many benefits:
- Reduction in infrastructure cost.
- Improvement in code writing skills.
- Helps you recover from performance bottlenecks as soon as you hit them.
Writing performance-driven code is something to which we all can aspire. It helps you make fewer mistakes that land up in degrading the performance of your application.